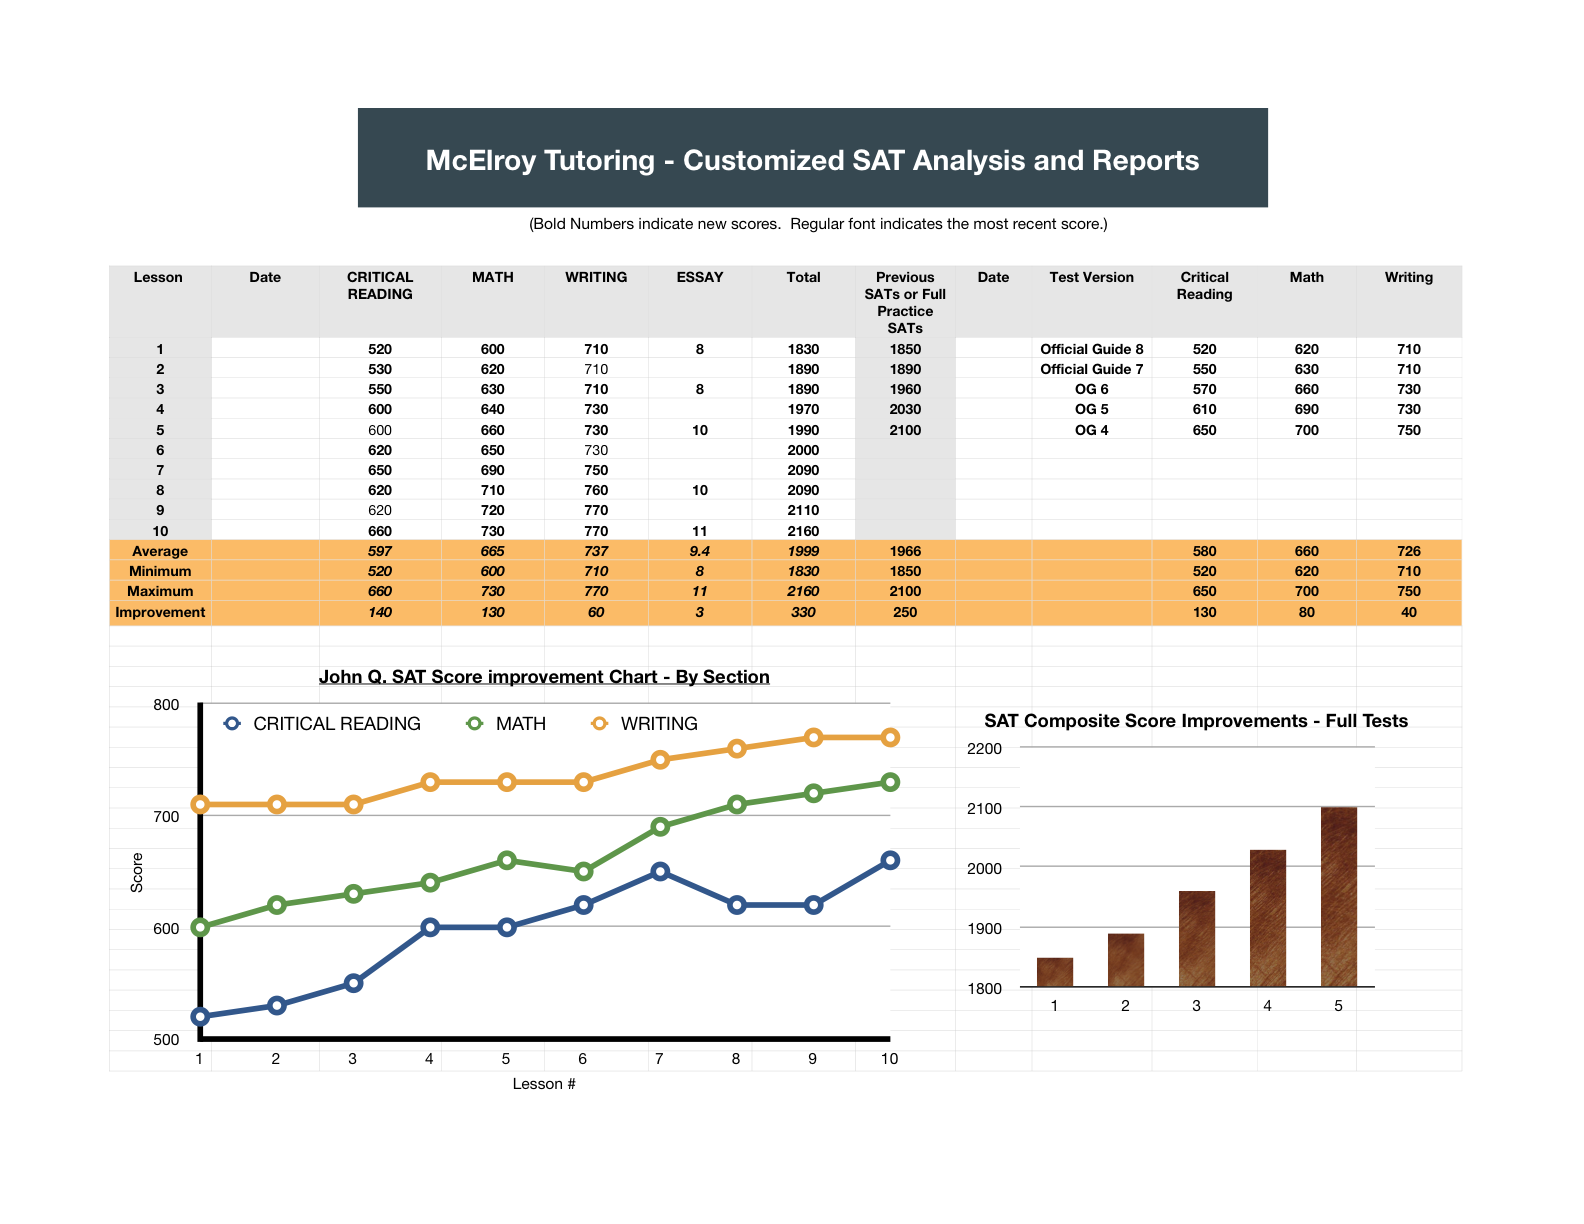
Score Improvements - McElroy Tutoring
I keep detailed records of my students' progress. Below is a typical improvement chart for a McElroy student taking the SAT.
On average, my students improve approximately 150 points on the Digital SAT, 7 points on the ACT, 12 points on the GRE, 120 points on the GMAT Focus, and 15 points on the LSAT.
On average, my students improve approximately 150 points on the Digital SAT, 7 points on the ACT, 12 points on the GRE, 120 points on the GMAT Focus, and 15 points on the LSAT.
Please keep in mind that your total improvement depends heavily on your starting score: the lower the initial score, the higher the potential for improvement, and vice-versa.
Smaller improvements (say, 85% to 95%, or 90% to 99%) for those already at the top of the score scale--while less impressive from a total score improvement standpoint--can qualify students for significant merit-based scholarships.
Smaller improvements (say, 85% to 95%, or 90% to 99%) for those already at the top of the score scale--while less impressive from a total score improvement standpoint--can qualify students for significant merit-based scholarships.
In the spring of 2005, I taught a series of SAT-preparation courses in Point Loma, California. The purpose of this class was to help my students find an affordable way to prepare for the SAT, and to quantify their score improvements under controlled conditions. (All students were required to take 4 full proctored diagnostic SATs.) The average combined improvement for these students was 254 points!
Student Score Breakdown for the June 2005 class
|
Student #
|
Previous tutoring?
|
Absences
|
Test #1
|
Test #2
|
Test #3
|
Test #4
|
First to Last Test Increase
|
Improve-
ment |
Combined Improve-
ment |
|
1
|
no
|
1
|
1310
|
1360
|
N/A
|
1450
|
140
|
140
|
180
|
|
2
|
no
|
0
|
1580
|
1780
|
1620
|
1700
|
120
|
200
|
200
|
|
3
|
no
|
0
|
920
|
970
|
1140
|
1230
|
310
|
310
|
310
|
Student Score Breakdown for the May 2005 class
|
Student #
|
Previous tutoring?
|
Absences
|
Test #1
|
Test #2
|
Test #3
|
Test #4
|
First to Last Test Increase
|
Improve-
ment |
Combined Improve-
ment |
|
1
|
no
|
0
|
1110
|
1330
|
1200
|
1430
|
320
|
320
|
350
|
|
2
|
no
|
0
|
1240
|
1470
|
1540
|
1480
|
240
|
300
|
340
|
|
3
|
no
|
0
|
1320
|
1450
|
1490
|
1420
|
100
|
170
|
230
|
Student Score Breakdown for the March 2005 class
|
Student #
|
Previous tutoring?
|
Absences
|
Test #1
|
Test #2
|
Test #3
|
Test #4
|
First to Last Test Increase
|
Improve-
ment |
Combined Improve-
ment |
|
1
|
no
|
1
|
1570
|
1790
|
1730
|
1850
|
280
|
280
|
340
|
|
2
|
no
|
0
|
2030
|
2190
|
2130
|
2150
|
120
|
160
|
190
|
|
3
|
no
|
0
|
2000
|
2020
|
2200
|
2210
|
210
|
210
|
230
|
|
4
|
yes
|
0
|
1370
|
1550
|
N/A
|
1610
|
240
|
240
|
290
|
|
5
|
no
|
2
|
1660
|
1800
|
N/A
|
1800
|
140
|
140
|
210
|
|
6
|
yes
|
1
|
1460
|
N/A
|
1640
|
1700
|
240
|
240
|
240
|
|
7
|
no
|
0
|
1090
|
1110
|
1330
|
1270
|
180
|
240
|
240
|
|
8
|
yes
|
1
|
1810
|
1950
|
1860
|
1990
|
180
|
180
|
190
|
(last updated 5/21/25)